
CR-1 / IR -1 Visa Timeline Statistics
The Statistics Below reflect applications filed within the last 360 days.Select the History Period: [ ALL Time ] [ Last Year ] [ Last 6 months ] [ Last 3 months ]
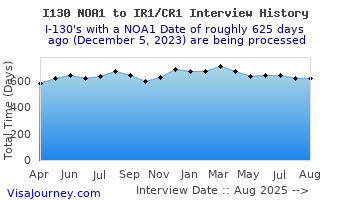
Overall Interview Statistics (for last 360 days)
| Total Records | Avg. Total Days to Interview | Avg. Days to I-130 NOA1 | Avg. Days btw NOA1 and NOA2 | Avg. Days btw NOA2 and Interview |
|---|---|---|---|---|
| 128 | 659 | >5 | 441 | 212 |
Service Center Statistics (I-130 files completed in the last 360 days)
| Service Center | Total Records | Avg. Total Days to Approval | Avg. Days to I-130 NOA1 | Avg. Days btw NOA1 and NOA2 |
|---|---|---|---|---|
| California Service Center | 22 | 445 | 3 | 441 |
| Nebraska Service Center | 36 | 437 | 4 | 433 |
| Potomac Service Center | 7 | 599 | 5 | 573 |
| Texas Service Center | 74 | 446 | 2 | 447 |
| Vermont Service Center | 34 | 422 | 2 | 420 |
| National Benefits Center | 3 | 301 | 2 | 299 |
Country Statistics (for last 360 days)
| Beneficiary's Country | Total Records | Num of Pending Applications | Num with Final Visa Approval | Avg. Days btw NOA2 and Interview |
|---|---|---|---|---|
| Philippines | 17 | 10 | 7 | 178 |
| Vietnam | 5 | 3 | 2 | 155 |
| Uganda | 1 | 1 | 0 | 446 |
| United Arab Emirates | 2 | 1 | 1 | 539 |
| Ireland | 1 | 1 | 0 | 328 |
| Kenya | 1 | 1 | 0 | 862 |
| Canada | 15 | 7 | 8 | 224 |
| Egypt | 2 | 1 | 1 | 635 |
| Japan | 3 | 1 | 2 | 149 |
| Australia | 2 | 0 | 2 | 114 |
| Ghana | 1 | 0 | 1 | 467 |
| Dominican Republic | 3 | 2 | 1 | 234 |
| Iran | 2 | 0 | 2 | 401 |
| Sierra Leone | 1 | 0 | 1 | 397 |
| Nigeria | 3 | 1 | 2 | 432 |
| United Kingdom | 15 | 9 | 6 | 156 |
| Colombia | 4 | 3 | 1 | 175 |
| Germany | 3 | 1 | 2 | 160 |
| Jamaica | 1 | 0 | 1 | 170 |
| Russia | 1 | 1 | 0 | 133 |
| Costa Rica | 2 | 2 | 0 | 112 |
| China | 1 | 0 | 1 | 235 |
| Thailand | 3 | 2 | 1 | 115 |
| South Africa | 1 | 0 | 1 | 128 |
| Pakistan | 3 | 2 | 1 | 491 |
| Suriname | 1 | 1 | 0 | 118 |
| Algeria | 1 | 0 | 1 | 102 |
| France | 2 | 1 | 1 | 136 |
| Portugal | 2 | 1 | 1 | 115 |
| Peru | 4 | 3 | 1 | 142 |
| Beneficiary's Country | Total Records | Num of Pending Applications | Num with Final Visa Approval | Avg. Days btw NOA2 and Interview |
| Brazil | 4 | 4 | 0 | 120 |
| Morocco | 2 | 1 | 1 | 163 |
| Zaire | 1 | 0 | 1 | 399 |
| Netherlands | 2 | 1 | 1 | 168 |
| New Zealand | 2 | 1 | 1 | 128 |
| Chile | 1 | 0 | 1 | 82 |
| India | 2 | 2 | 0 | 136 |
| Serbia | 1 | 1 | 0 | 148 |
| Moldova | 1 | 1 | 0 | 240 |
| Mexico | 2 | 1 | 1 | 325 |
| Barbados | 1 | 1 | 0 | 214 |
| Singapore | 2 | 1 | 1 | 106 |
| Austria | 1 | 1 | 0 | 118 |
| Sweden | 1 | 0 | 1 | 146 |
| Antigua | 1 | 0 | 1 | 114 |
| Tunisia | 1 | 1 | 0 | 124 |
Status By Consulate, Visa Type (statistics for last 360 days)
| Consulate | Total Records | Num of Pending Applications | Num with Final Visa Approval | Avg. Days btw NOA2 and Interview |
|---|---|---|---|---|
| Manila, Philippines | 16 | 10 | 6 | 178 |
| Ho Chi Minh City, Vietnam | 4 | 2 | 2 | 158 |
| Kenya | 2 | 2 | 0 | 654 |
| United Arab Emirates | 3 | 1 | 2 | 610 |
| Dublin, Ireland | 1 | 1 | 0 | 328 |
| Montreal, Canada | 16 | 7 | 9 | 231 |
| Egypt | 2 | 1 | 1 | 635 |
| Tokyo, Japan | 4 | 1 | 3 | 145 |
| Sydney, Australia | 2 | 0 | 2 | 114 |
| Ghana | 1 | 0 | 1 | 467 |
| Dominican Republic | 3 | 2 | 1 | 234 |
| Ankara, Turkey | 2 | 0 | 2 | 401 |
| Kazakhstan | 1 | 0 | 1 | 397 |
| London, United Kingdom | 13 | 7 | 6 | 148 |
| Bogota, Colombia | 4 | 3 | 1 | 175 |
| Frankfurt, Germany | 5 | 2 | 3 | 163 |
| Jamaica | 1 | 0 | 1 | 170 |
| Warsaw, Poland | 1 | 1 | 0 | 133 |
| Costa Rica | 2 | 2 | 0 | 112 |
| Hong Kong, China | 1 | 0 | 1 | 235 |
| Bangkok, Thailand | 3 | 1 | 2 | 154 |
| South Africa | 1 | 0 | 1 | 128 |
| Nigeria | 2 | 1 | 1 | 483 |
| Islamabad, Pakistan | 2 | 2 | 0 | 360 |
| Guyana | 1 | 1 | 0 | 118 |
| Algiers, Algeria | 1 | 0 | 1 | 102 |
| France | 4 | 2 | 2 | 126 |
| Peru | 2 | 2 | 0 | 101 |
| Rio de Janeiro, Brazil | 4 | 4 | 0 | 120 |
| Morocco | 2 | 1 | 1 | 163 |
| Consulate | Total Records | Num of Pending Applications | Num with Final Visa Approval | Avg. Days btw NOA2 and Interview |
| Armenia | 8 | 6 | 2 | 240 |
| Auckland, New Zealand | 2 | 1 | 1 | 128 |
| Chile | 1 | 0 | 1 | 82 |
| Mumbai, India | 2 | 2 | 0 | 136 |
| Serbia | 1 | 1 | 0 | 148 |
| Moldova | 1 | 1 | 0 | 240 |
| Barbados | 2 | 1 | 1 | 164 |
| Singapore | 2 | 1 | 1 | 106 |
| Austria | 1 | 1 | 0 | 118 |
| Sweden | 1 | 0 | 1 | 146 |
| Tunisia | 1 | 1 | 0 | 124 |
Pending - Visa not yet received/ not in hand
Timelines
 ver 5.0