
AOS Timelines Statistics
The Statistics Below reflect applications filed within the last 360 days.Select the History Period: [ ALL Time ] [ Last Year ] [ Last 6 months ] [ Last 3 months ]
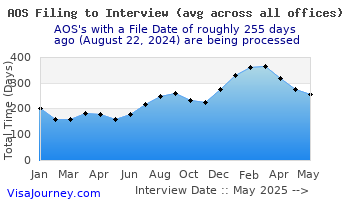
Overall AOS Statistics (for the last 360 days)
| Total Records | Avg. Total Days to Interview | Avg. Days to 1st NOA | Avg. Days btw 1st NOA Biometrics | Avg. Days btw Biometrics and Interview (if interview required) | Avg. Days btw Biometrics and Decision Date | Avg. Days btw Decision Date and Receiving Green Card |
|---|---|---|---|---|---|---|
| 21 | 327 | 8 | 31 | 288 | 311 | 9 |
Statistics by AOS Office (for the last 360 days)
| AOS Office | Total Records | Avg. Total Days to Interview | Avg. Days to 1st NOA | Avg. Days btw 1st NOA Biometrics | Avg. Days btw Biometrics and Interview (if interview required) | Avg. Days btw Biometrics and Decision Date | Avg. Days btw Decision Date and Receiving Green Card |
|---|---|---|---|---|---|---|---|
| Nashville TN | 1 | 833 | 5 | 42 | 786 | ||
| San Diego CA | 1 | 448 | 6 | 24 | 418 | 418 | |
| Milwaukee WI | 1 | 652 | 623 | ||||
| Sacramento CA | 1 | 450 | 11 | 32 | 407 | 408 | |
| Denver CO | 2 | 321 | 7 | 23 | 292 | 306 | 8 |
| Baltimore MD | 1 | 394 | 7 | 20 | 367 | 402 | |
| San Antonio TX | 1 | 327 | 6 | 33 | 288 | 312 | |
| Saint Louis MO | 1 | 344 | 2 | 22 | 320 | 342 | 13 |
| Providence RI | 2 | 200 | 12 | 58 | 130 | 141 | 8 |
| Dallas TX | 1 | 136 | 14 | 23 | 99 | 100 | |
| Phoenix AZ | 2 | 243 | 2 | 26 | 200 | ||
| Philadelphia PA | 1 | 447 | 0 | 40 | 407 | 408 | |
| Helena MT | 1 | 467 | 5 | 42 | 420 | ||
| San Francisco CA | 1 | 111 | 3 | 21 | 87 | ||
| Chicago IL | 1 | 144 | 38 | 22 | 84 | ||
| San Bernadino CA | 1 | 303 | 4 | 26 | 273 | 273 | 9 |
| Albany NY | 1 | 174 | 3 | 25 | 146 | ||
| Louisville KY | 1 | 103 | 6 | 22 | 75 |
Back to Timelines
 ver 5.0